
The Current “Band-Aid” Fix
We have all heard the issues being discussed around excess supply related to the overproduction of daytime solar generation in the NEM.
The solution so far has been Solar Soak Tariffs, designed to alleviate the increasing costs that both domestic and commercial consumers in Australia face. Designed to create a market that incentivises generators to keep pushing supply into the NEM while prices dip in the middle of the day, whilst attempting to avoid negative pricing signals that hamper the market and create chaos for generators and traders selling into it, I only see this as a temporary solution.
And not a very effective one either.
I also see this as yet another situation that may create more angst and consumer disappointment. Consumers already consider the market to give with one hand whilst taking it away with the other.
The other, more effective and viable solution has been the growth of available storage to soak up generation that is not viable to sell into the market due to low or negative pricing, which presents generators with the potential for short-term negative returns.
This is a good solution that will also offer the NEM a tool for price stabilisation and long-term price reductions for consumers at all levels of the market.
Nevertheless, with large-scale BESS projects being expensive to roll out with long ROI prospects, investment has been slower than we would like to create a solution at the scale required.
I think that we are overlooking the real solution and the long-term marriage between two problems that could make a solution.
Two Wrongs That Make a Right
We have briefly discussed one of the problems that the NEM now faces with overinvestment in large-scale solar. Short-sighted energy policy that does not require large-scale solar projects in the NEM to couple matching BESS capacity investment was a mistake.
One of many made in the renewable roadmap rolled out by our governments as they seemingly wander through this space without an adequate torch or guide to show them the “best path”.
Here, the theory of “Two Wrongs Making a Right” explores how the duck curve and data centre demand curve can help each other to co-exist in “wedded bliss”.
This could be the Wedding of the Year!
The necessary exponential growth of data centres entering the market in Australia presents several issues to do with the availability of supply to satisfy their thirst for energy during all times of the day.
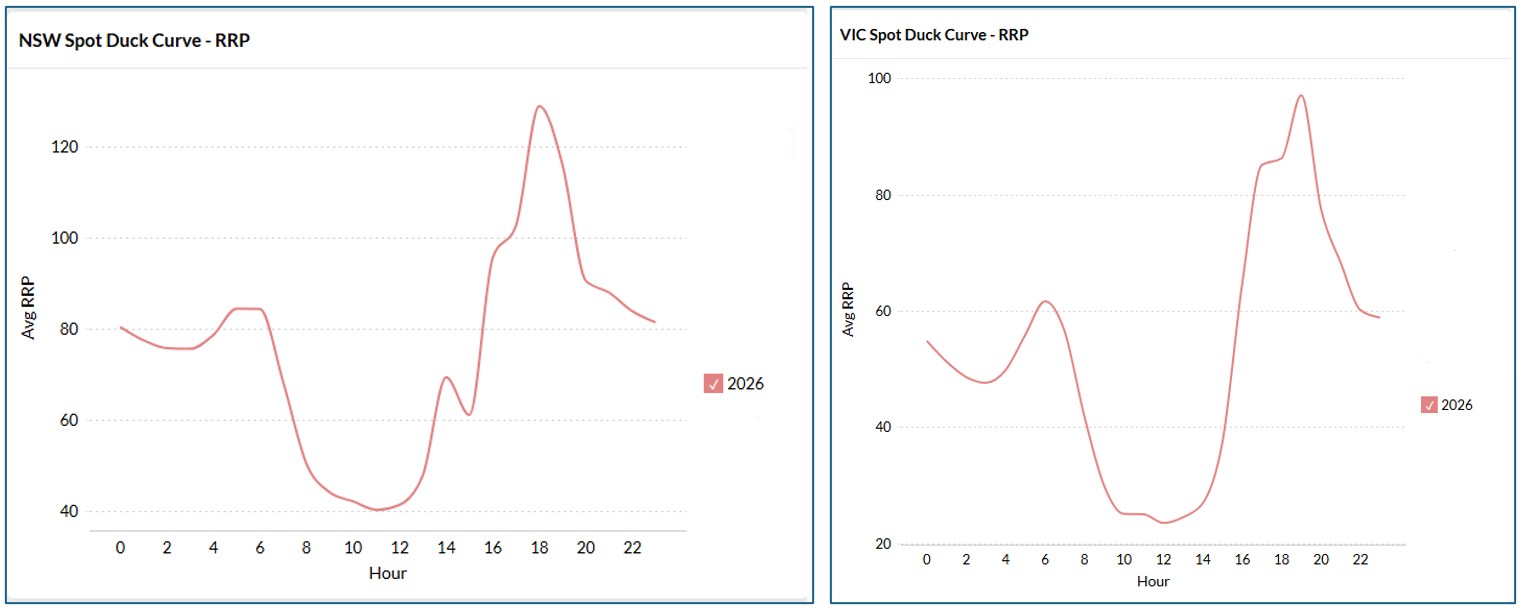
Here, we explore two curves. The Duck Curve resulted from excess daytime generation where demand cannot meet supply, pushing pricing out of an “equilibrium pricing” position. Data Centre Demand Curves, meanwhile, show a growing thirst to consume.
The key insight is that data centres can partially “fill in” the solar-driven trough of the Duck Curve, particularly if some of their computing load can be shifted toward the middle of the day when solar generation is abundant.
NSW and VIC Duck Curves
Data Centre Demand Curves in NSW and VIC
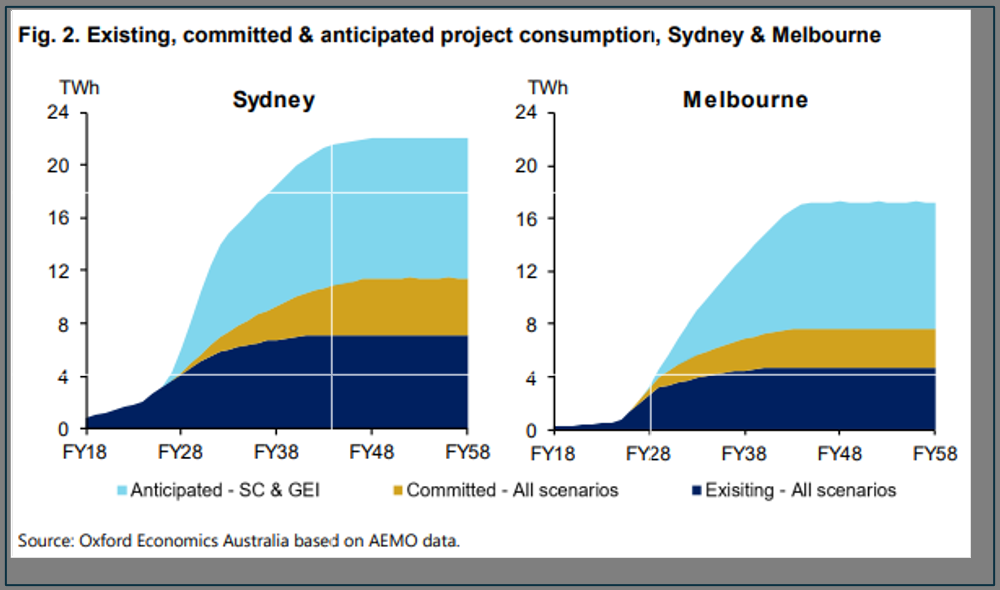
Data Centre Adjusted Duck Curves
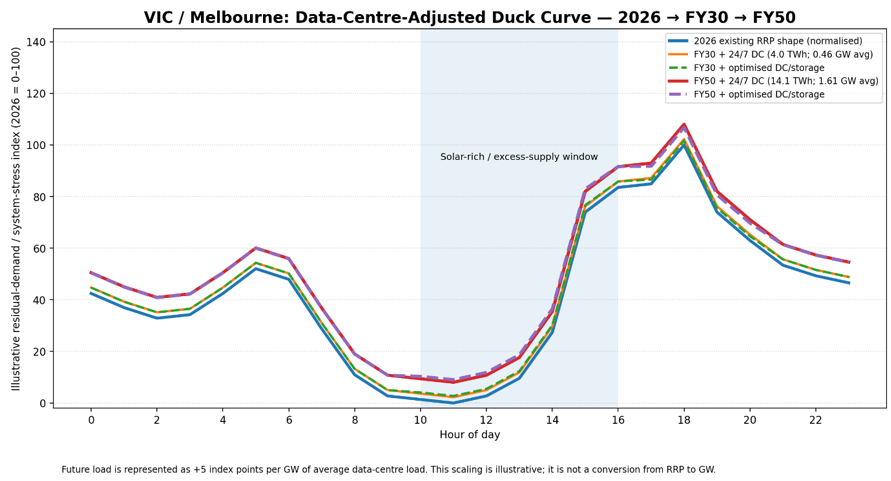
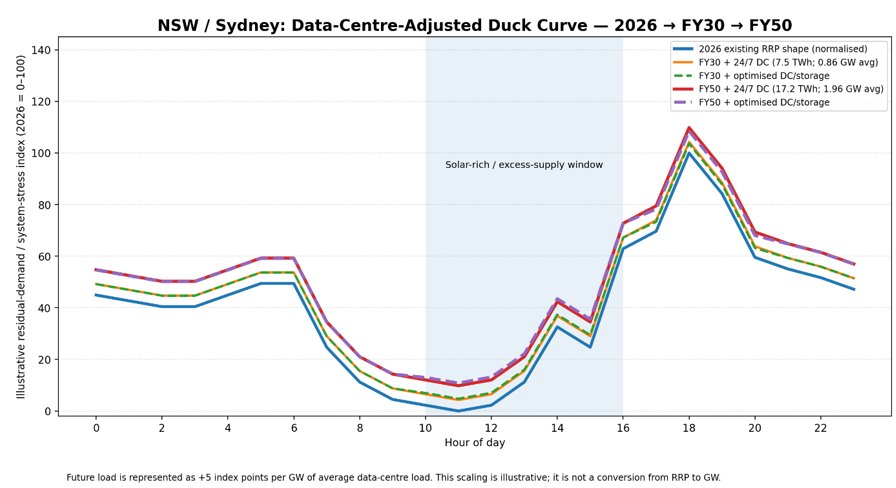
Now let’s look at the concept of introducing Data Centre Adjusted variables into the existing Duck Curves that we looked at.
What I Think the Curve Is Telling Us
The important conceptual change is:
Today
Solar generation → large midday supply surplus → low/negative residual demand → steep evening ramp → high prices.
With Substantial Data Centre Demand
Solar generation → data centres absorb some of the midday surplus → shallower Duck Curve → less extreme midday excess → still significant evening peak.
So, the resulting curve shouldn't simply be another larger Duck Curve. It should start to look more like a “filled Duck Curve” or potentially a “camel-back” curve, depending on how much data-centre demand is flexible and the future growth of the data centre market.
There are three particularly interesting effects:
- The midday trough rises
Data centres consume electricity while rooftop and utility-scale solar are producing heavily.
- Solar curtailment can potentially fall
Instead of having to reduce solar generation because supply exceeds demand, some of that electricity can be consumed by the new load.
- The evening peak remains a problem
Unless data-centre operators also use batteries, workload shifting or other flexibility, their underlying 24/7 demand doesn't disappear at 5–8 pm. AEMO specifically identifies data centres as one of the fastest-growing sources of electricity demand.
An Important Qualification
The charts I created are deliberately an illustrative example rather than a forecast of future RRP. The three source charts have different units:
- Data-centre consumption = TWh/year
- RRP = $/MWh
- The Duck Curve is essentially describing the relationship between generation and residual demand.
This relationship has the potential to develop into an eventual marriage as the growth of the data centre market ramps up over time, which, given the age of technology and AI tools, seems imminent.
It isn't mathematically valid simply to add 2 GW of data-centre demand directly to an $/MWh RRP curve.
Therefore, what I've done instead is to use the shape of the 2026 NSW/VIC RRP curves and introduce the forecast data-centre load as a conceptual demand-pressure component.
AEMO's actual modelling uses half-hourly demand traces and separates components such as operational demand, PV generation, EVs, batteries and electrification, which is the appropriate methodology for a rigorous version of this analysis.
Introducing Storage as the 3rd Wheel in This Marriage
Now that we have considered the concept of amalgamating these issues to see how they relate and the potential outcomes as a solution, let’s take this a little further and explore the concept of a three-stage curve by making this marriage “polygamous”.
BESS now enters this marriage, as we start to see how it fills the Duck Curve ever so slightly more.
Advanced Energy Policy in the Australian Energy Market can further improve this scenario, whilst also delivering additional spin-off benefits into this matrix.
Let’s consider and explore how using the current investment propositions into future BESS projects could contribute to this solution.
Federal and State Energy Policy driving the investment of large-scale, market-forming and integrated BESS systems will accelerate the solution and deliver greater overall market outcomes.
Perhaps we also need to consider financial and social outcomes too, though, as the money to do this will have to come from somewhere.
With the lack of cash reserves in Australia, and missed opportunities to grow precious metals reserves such as gold and silver when we had the opportunity, have we squandered the chance to fund a solution that will stabilise the grid both in the NEM and WEM whilst building a more AI-capable Australia?
Have we lost a greater opportunity and chance to attract higher levels of AI and Tech-based investment into Australia?
Maybe. Let’s see what could be.
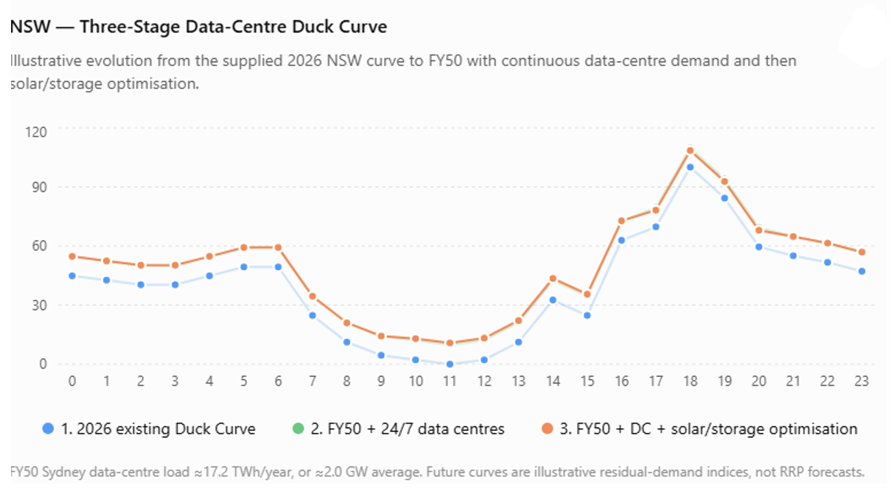
The Three-Stage Curve
The curve explores and illustrates:
- Existing 2026 Duck Curve
Shows the current solar-driven trough.
- FY50 Duck Curve + 24/7 Data Centres
Shows how Sydney's ~2 GW and Melbourne's ~1.6 GW continuous loads change the residual demand.
- FY50 Duck Curve + Data Centres + Solar/Storage Optimisation
Assumes a portion of data-centre workload and/or battery charging is deliberately moved into the 10 am–4 pm solar surplus period.
That third curve could demonstrate a potentially powerful proposition:
Data centres don't necessarily make the Duck Curve worse — if their demand is intelligently aligned with excess renewable generation, they can become a mechanism for absorbing the Duck Curve.
That is also consistent with the broader direction of AEMO's planning, which increasingly considers storage, demand flexibility and emerging large loads as part of the integrated NEM system.
Conclusion
Australia needs to strip back the way we think about investment, AI and Tech growth and grid stabilisation. Stronger and more carefully considered energy policy and modelling from experts will all help things here fall into place.
We need to be ahead of the game when it comes to our cash and gold reserves and even start to change how we think about oil exploration and refinement. We are rich in resources, but sadly, the word “poverty” comes to mind when I consider brains and longer-term solutions presented by our trusted governments and politicians.
To progress in this world even further, we have to consider wealth accumulation models from the Chinese (please do not look at our American friends right now, they are getting it very wrong), US investment models and European and Middle Eastern Tech and Infrastructure growth models.
We have it all here. We just need to learn now how to use it.
The final outcome may be a more stable grid, harnessing the benefits of AI and Tech investment to further grow our ideas and solutions for all types of issues.
If we have the ideas, the data is out there from multiple sources to bring them to life.
A great example of this is this very report.